首页 > 资源 > 文章详情
GCP 上实现可观测性数据的多租户管理
在 GKE 上运行 Open Telemetry Collector
背景
越来越多的用户希望把组织中不同来源的可观测数据存储在一个中央 Google Cloud 项目中,通过中央存储的汇总数据,为每个租户分配查看的权限并生成相关计费报告。这些数据可以来自不同的 GCP 项目或者其他云的环境中,它们包括日志、监控数据、追踪数据等。本文将围绕这个话题,展开讨论相关的解决方案来实现这个需求。
云日志 (Cloud Logging)
组件介绍
日志接收器 (Log Sink)
日志接收器控制 Cloud Logging 路由日志的方式。使用日志接收器,您可以将部分或全部日志路由到日志存储桶,GCP 项目,BigQuery 数据集,Pub/Sub 主题,或者 GCS 存储桶等。接收器包含包含项过滤器、可选的排除过滤器和目标位置。
日志视图 (Log View)
借助日志视图,您可以控制有权访问您的日志存储分区中的日志的人员。
对于每个日志存储桶,Cloud Logging 都会自动创建 _AllLogs 视图,以显示该存储桶中存储的所有日志。Cloud Logging 还会为 _Default 存储桶创建一个名为 _Default 的视图。_Default 存储桶的 _Default 视图会显示除数据访问审核日志之外的所有日志。_AllLogs 和 _Default 视图不可修改,您无法将其删除。
而自定义日志视图为您提供了一种高级、精细的方法来控制对日志数据的访问权限。我们设想一个场景,您在此场景中将组织的所有日志存储在一个中央 Google Cloud 项目中。由于日志存储分区可以包含来自多个 Google Cloud 项目的日志,因此您可能需要控制不同用户可以查看哪些 Google Cloud 项目中的日志。借助自定义日志视图,您可以授权一位用户访问单个 Google Cloud 项目中的日志,而授权另一位用户访问所有 Google Cloud 项目中的日志。
具体做法
1. 创建存储桶。Cloud Logging 存储分区可存储从其他 Google Cloud 项目、文件夹或组织路由的日志,下面我们通过创建接收器将日志路由到日志存储桶。创建log sink 来将日志路由到存储桶
gcloud logging buckets create flius-sink-bucket \\ --location=global \\ --project=flius-vpc-2 |
2. 创建 log sink 来将日志路由到存储桶
gcloud logging sinks create custom-sink \\ logging.googleapis.com/projects/flius-vpc-2/locations/global/buckets/flius-sink-bucket \\ --log-filter='logName:cloudaudit.googleapis.com' \\ --description="All audit logs from my org log sink" \\ --organization=<organization id> \\ --include-children |
--include-children 标志它会允许包含来自指定组织中所有 Google Cloud 项目的日志。
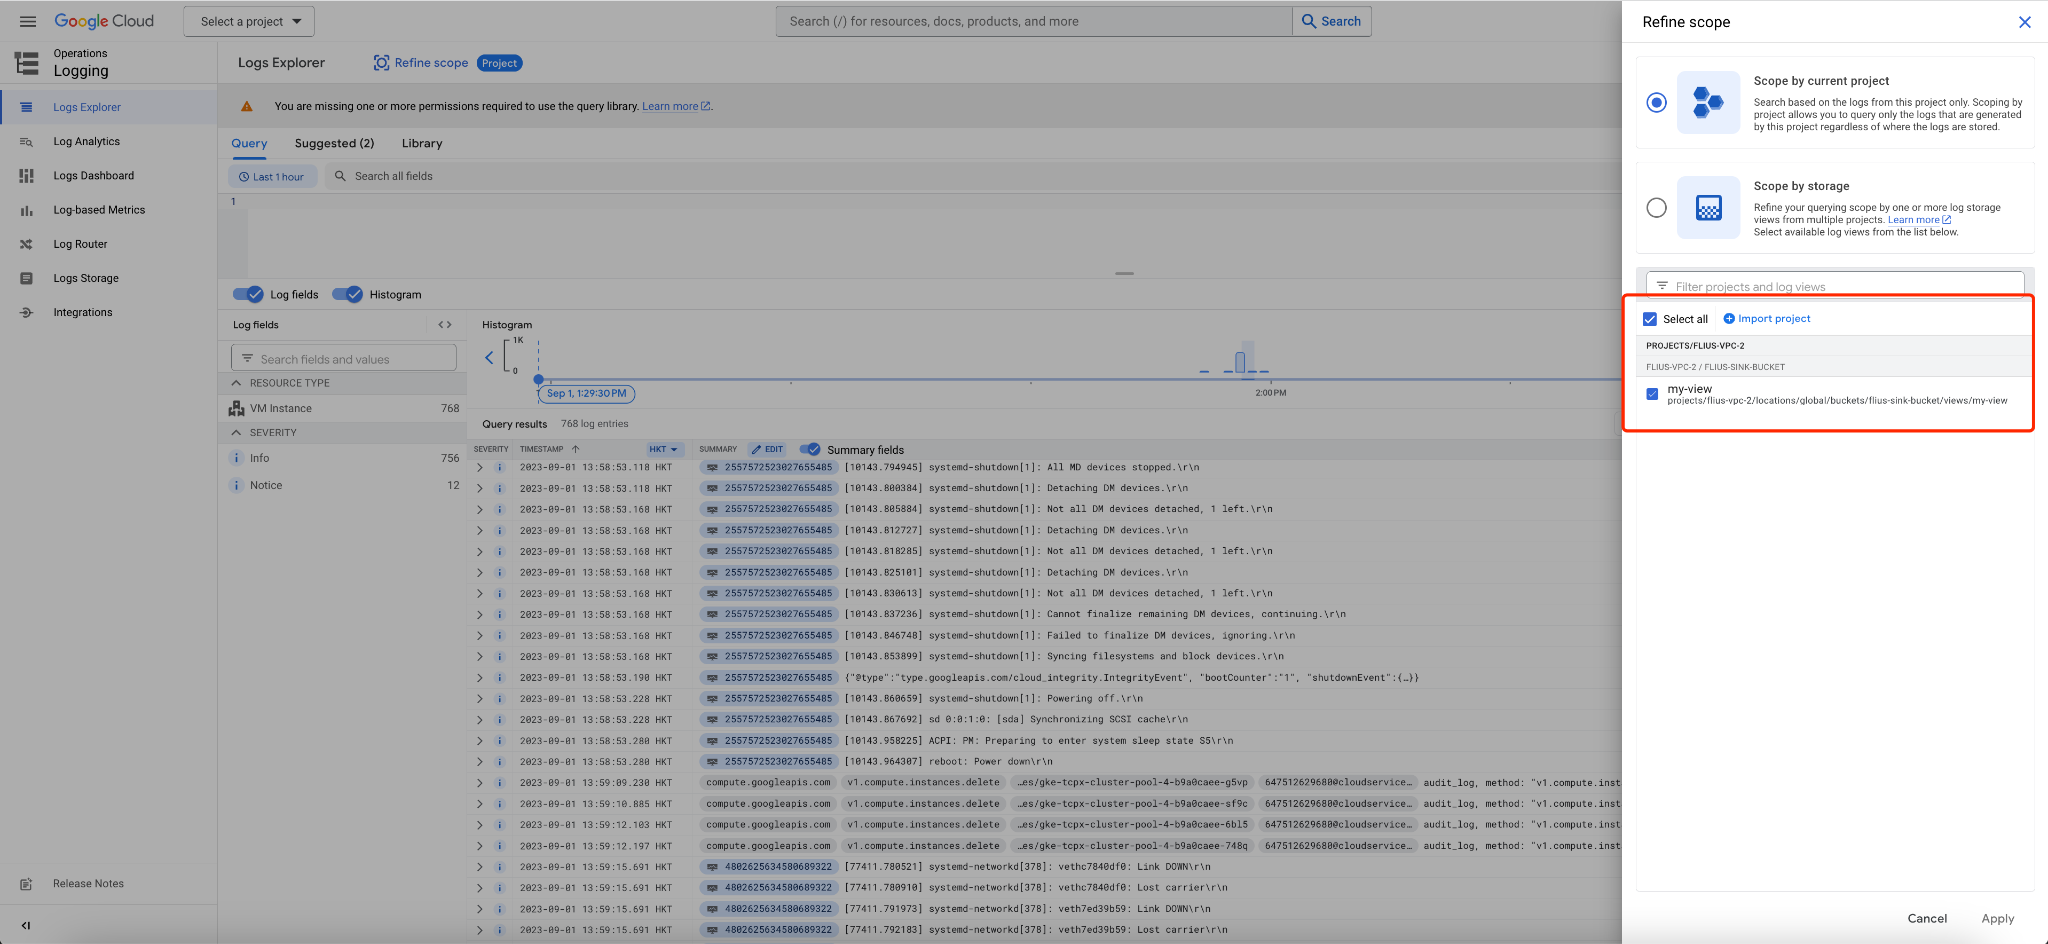
3. 创建日志视图,通过日志视图,您可以精确控制谁有权访问日志存储分区中的日志
gcloud logging views create my-view --bucket=flius-sink-bucket --location=us-central1 --log-filter='resource.type="gce_instance"' |
4. 授予对日志视图的访问权限
获取项目的 IAM 政策,并将其写入 JSON 格式的本地文件
gcloud projects get-iam-policy --format json > output.json |
添加一个 IAM 条件,允许用户从您创建的存储桶读取数据
{ "bindings": [ { "members": [ "user:username@gmail.com" ], "role": "roles/logging.viewAccessor", "condition": { "title": "Bucket reader condition example", "description": "Grants logging.viewAccessor role to user username@gmail.com for the VIEW_ID log view.", "expression": "resource.name == \\"projects/flius-vpc-2/locations/global/buckets/flius-sink-bucket/views/my-view\\"" } } ], "etag": "BwWd_6eERR4=", "version": 3 } |
更新 IAM 政策
gcloud projects set-iam-policy flius-vpc-2 output.json |
5. 验证:可见指定的用户能够查看项目的日志。
Grafana
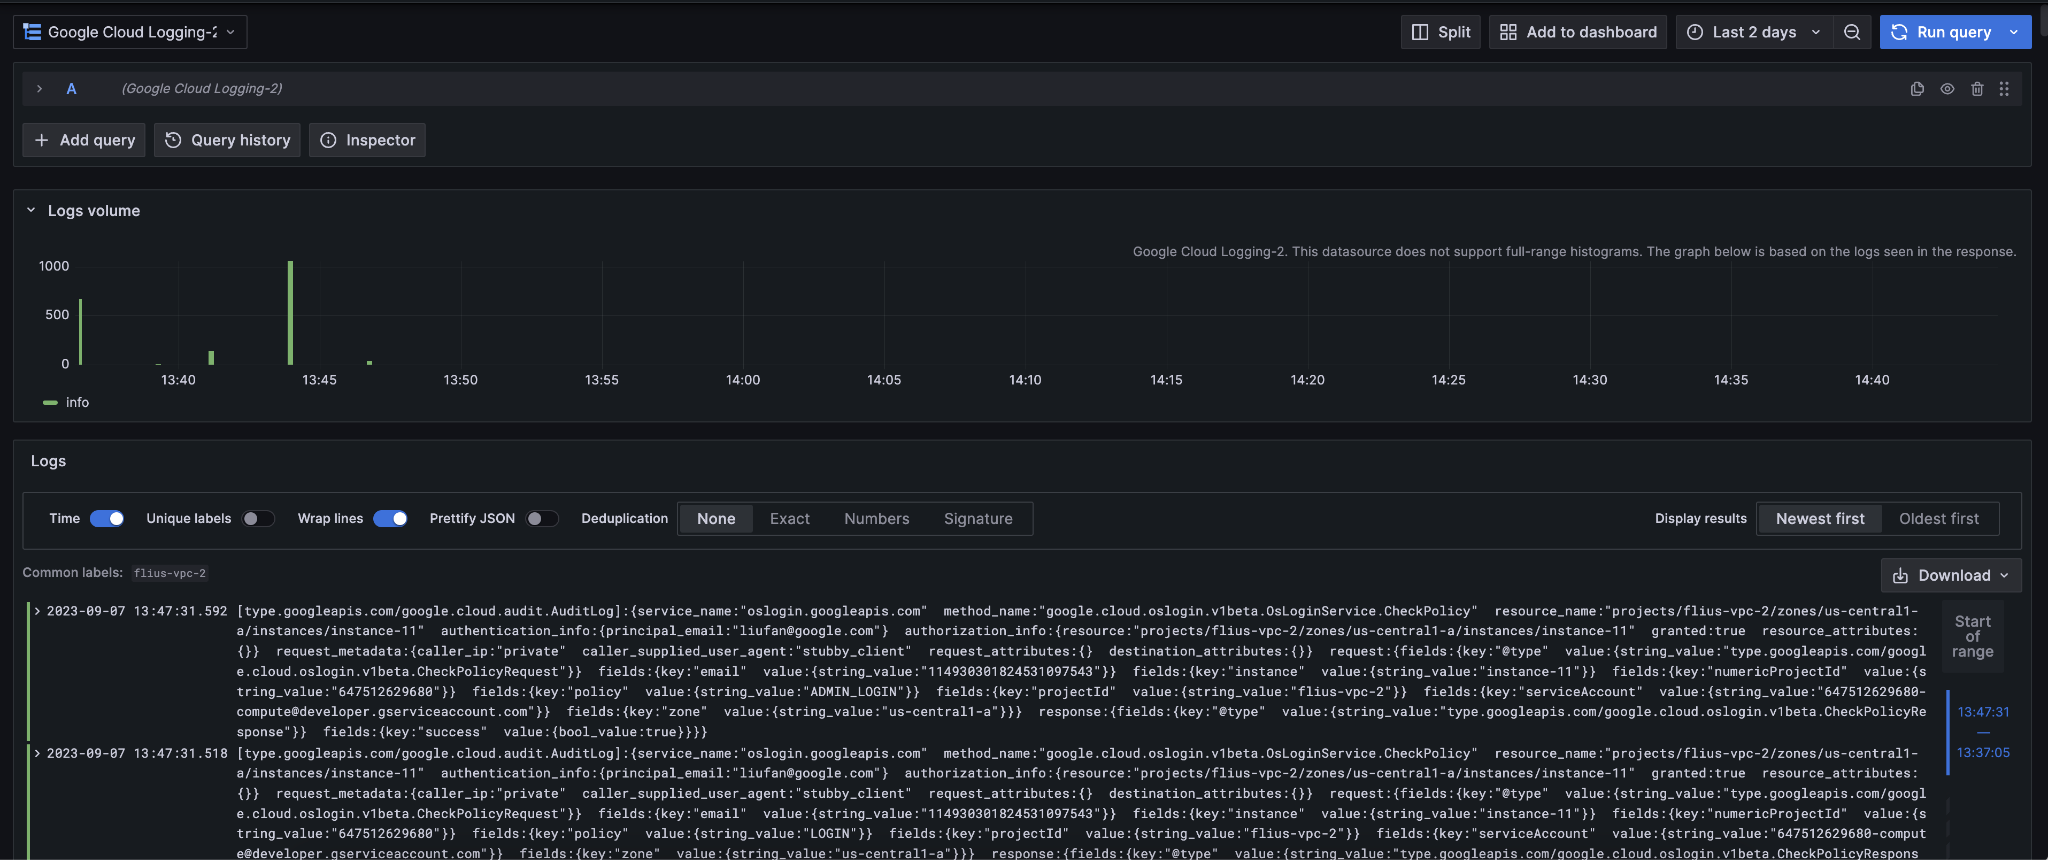
你还可以通过安装 Grafana 的 Cloud logging plugin 来查看日志,具体做法参见:
https://grafana.com/grafana/plugins/googlecloud-logging-datasource/
云监控 (Cloud Monitoring)
为了提供统一的实现,我们采用 Open Telemetry Collector 来进行监控数据的收集,以爬取标准 Prometheus 指标并将这些指标报告给 Google Cloud Managed Service for Prometheus。Open Telemetry Collector 是一个代理,您可以自行部署并将其配置为不同环境(GCP 或 GCP 以外的环境)导出遥测数据到 GCP Managed Service for Prometheus。
通过 Open Telemetry Collector,您可以实现:
在流水线中配置不同的导出器来将遥测数据路由到多个后端。
收集器还支持来自监控指标、日志和跟踪记录的信号,因此您可以使用收集器在一个代理中处理所有三种信号类型。
Open Telemetry 的不限定供应商的数据格式(Open Telemetry 协议,即 OTLP)支持强大的库和可插入式收集器组件生态系统。这允许接收、处理和导出数据的各种可自定义选项。
这些优势的代价是运行 Open Telemetry Collector 需要自行管理的部署和维护方法。
对于监控来说,GCP 目前没有提供和日志一样单独的视图来设置控制权。所以我们采用项目的范围来支持多租户的场景。本文中我们以在 GKE 上部署一个应用程序为例,为大家展现如何使用 open telemetry collector 来汇总监控指标。
具体做法
创建 GKE 集群
gcloud beta container --project "flius-vpc-2" clusters create "otele-cluster" \\ --num-nodes "1" \\ --enable-ip-alias \\ --no-enable-managed-prometheus \\ --workload-pool "flius-vpc-2.svc.id.goog" \\ --node-locations "us-central1-c" |
配置 Workload Identity
创建和绑定服务账号
gcloud config set project flius-vpc-2 \\ && gcloud iam service-accounts create gmp-test-sa \\ && gcloud iam service-accounts add-iam-policy-binding \\ --role roles/iam.workloadIdentityUser \\ --member "serviceAccount:flius-vpc-2.svc.id.goog[default/default]" \\ gmp-test-sa@flius-vpc-2.iam.gserviceaccount.com \\ && kubectl annotate serviceaccount \\ --namespace default \\ default \\ iam.gke.io/gcp-service-account=gmp-test-sa@flius-vpc-2.iam.gserviceaccount.com |
向服务账号授权
gcloud projects add-iam-policy-binding flius-vpc-2 \\ --member=serviceAccount:gmp-test-sa@flius-vpc-2.iam.gserviceaccount.com \\ --role=roles/monitoring.metricWriter |
在 GKE 上运行 Open Telemetry Collector
首先为 Open Telemetry Collector 准备一个 config 文件
receivers: prometheus: config: scrape_configs: - job_name: 'otele-job' kubernetes_sd_configs: - role: pod relabel_configs: - source_labels: [__meta_kubernetes_pod_label_app_kubernetes_io_name] action: keep regex: prom-example - source_labels: [__meta_kubernetes_pod_annotation_prometheus_io_path] action: replace target_label: __metrics_path__ regex: (.+) - source_labels: [__address__, __meta_kubernetes_pod_annotation_prometheus_io_port] action: replace regex: (.+):(?:\\d+);(\\d+) replacement: $1:$2 target_label: __address__ - action: labelmap regex: __meta_kubernetes_pod_label_(.+)
processors: resource: attributes: - key: "cluster" value: "otele-cluster" action: upsert - key: "namespace" value: "default" action: upsert - key: "location" value: "us-central1-c" action: upsert
transform: # "location", "cluster", "namespace", "job", "instance", and "project_id" are reserved, and # metrics containing these labels will be rejected. Prefix them with exported_ to prevent this. metric_statements: - context: datapoint statements: - set(attributes["exported_location"], attributes["location"]) - delete_key(attributes, "location") - set(attributes["exported_cluster"], attributes["cluster"]) - delete_key(attributes, "cluster") - set(attributes["exported_namespace"], attributes["namespace"]) - delete_key(attributes, "namespace") - set(attributes["exported_job"], attributes["job"]) - delete_key(attributes, "job") - set(attributes["exported_instance"], attributes["instance"]) - delete_key(attributes, "instance") - set(attributes["exported_project_id"], attributes["project_id"]) - delete_key(attributes, "project_id")
batch: # batch metrics before sending to reduce API usage send_batch_max_size: 200 send_batch_size: 200 timeout: 5s
memory_limiter: # drop metrics if memory usage gets too high check_interval: 1s limit_percentage: 65 spike_limit_percentage: 20
exporters: googlemanagedprometheus: project: "flius-vpc-1"
service: pipelines: metrics: receivers: [prometheus] processors: [batch, memory_limiter, resource, transform] exporters: [googlemanagedprometheus] |
这里请大家注意上面加粗的字体,您可以根据需要修改他们,来指定你的集群相关配置。您还可以观察到,我们在 googlemanagedprometheus exporter 的配置中,把监控数据导出到了另一个项目 flius-vpc-1,因为我们需要用项目的范围来管理不同租户的监控数据,下面来看一看如何将不同的项目监控数据进行汇总的。
为 Open Telemetry Collector 创建 configmap
kubectl -n default create configmap otel-config --from-file config.yaml |
部署示例应用
kubectl -n default apply -f https://raw.githubusercontent.com/GoogleCloudPlatform/prometheus-engine/v0.7.4/examples/example-app.yaml |
部署 Open Telemetry Collector,创建包含以下内容的 collector-deployment.yaml 文件
apiVersion: rbac.authorization.k8s.io/v1 kind: ClusterRole metadata: name: default:prometheus-test rules: - apiGroups: [""] resources: - pods verbs: ["get", "list", "watch"] --- apiVersion: rbac.authorization.k8s.io/v1 kind: ClusterRoleBinding metadata: name: default:prometheus-test roleRef: apiGroup: rbac.authorization.k8s.io kind: ClusterRole name: default:prometheus-test subjects: - kind: ServiceAccount namespace: default name: default --- apiVersion: apps/v1 kind: Deployment metadata: name: otel-collector spec: replicas: 1 selector: matchLabels: app: otel-collector template: metadata: labels: app: otel-collector spec: containers: - name: otel-collector image: otel/opentelemetry-collector-contrib:0.74.0 args: - --config - /etc/otel/config.yaml volumeMounts: - mountPath: /etc/otel/ name: otel-config volumes: - name: otel-config configMap: name: otel-config |
在 kubernetes 集群中创建 collector 的部署
kubectl -n create -f collector-deployment.yaml |
设置监控范围
在 GCP 的控制台,进入 Monitoring → Settings 配置中,选择 ADD GCP PROJECTS,把 flius-vpc-1 添加进来(注:当前项目为 flius-vpc-2)。
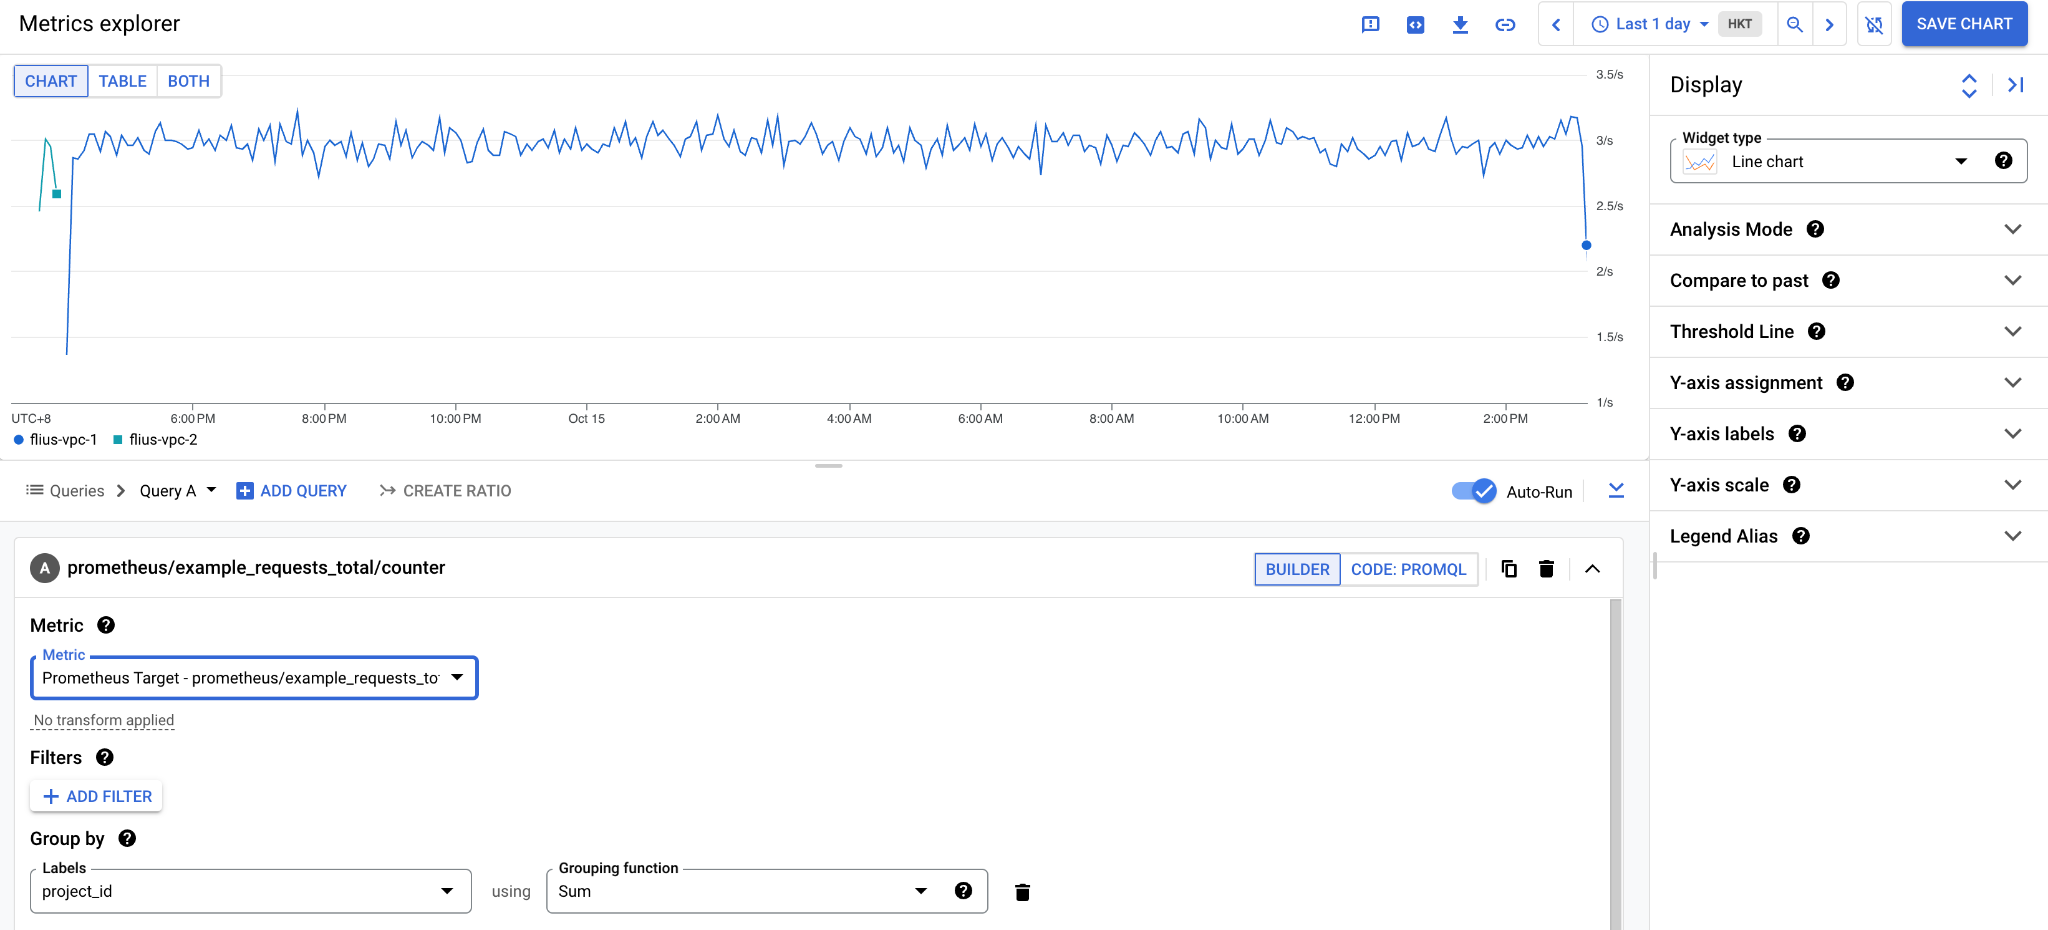
验证监控指标
进入 Monitoring → Metrics Explorer 中,选择 example_requests_total 指标,Group By 设置为 project_id,你就可以看到示例应用的监控数据已经根据项目进行了汇总。当然,您也可以直接使用 PromQL 来查询这些 Prometheus 指标,只需要在 Metrics Explorer 中用 CODE: PROMQL 来进行切换。
Grafana
你还可以通过安装 Grafana 的 Cloud Monitoring plugin 来查看监控,具体做法参见:
https://grafana.com/grafana/plugins/stackdriver/
云追踪 (Cloud Trace)
Cloud Trace 是 Google Cloud 的分布式跟踪系统,可帮助您了解应用处理来自用户或其他应用的传入请求所需的时间,以及完成处理请求时执行的操作(例如 RPC 调用)所需的时间。下面我们来简要介绍如何使用 Cloud Trace 导出跟踪记录数据。
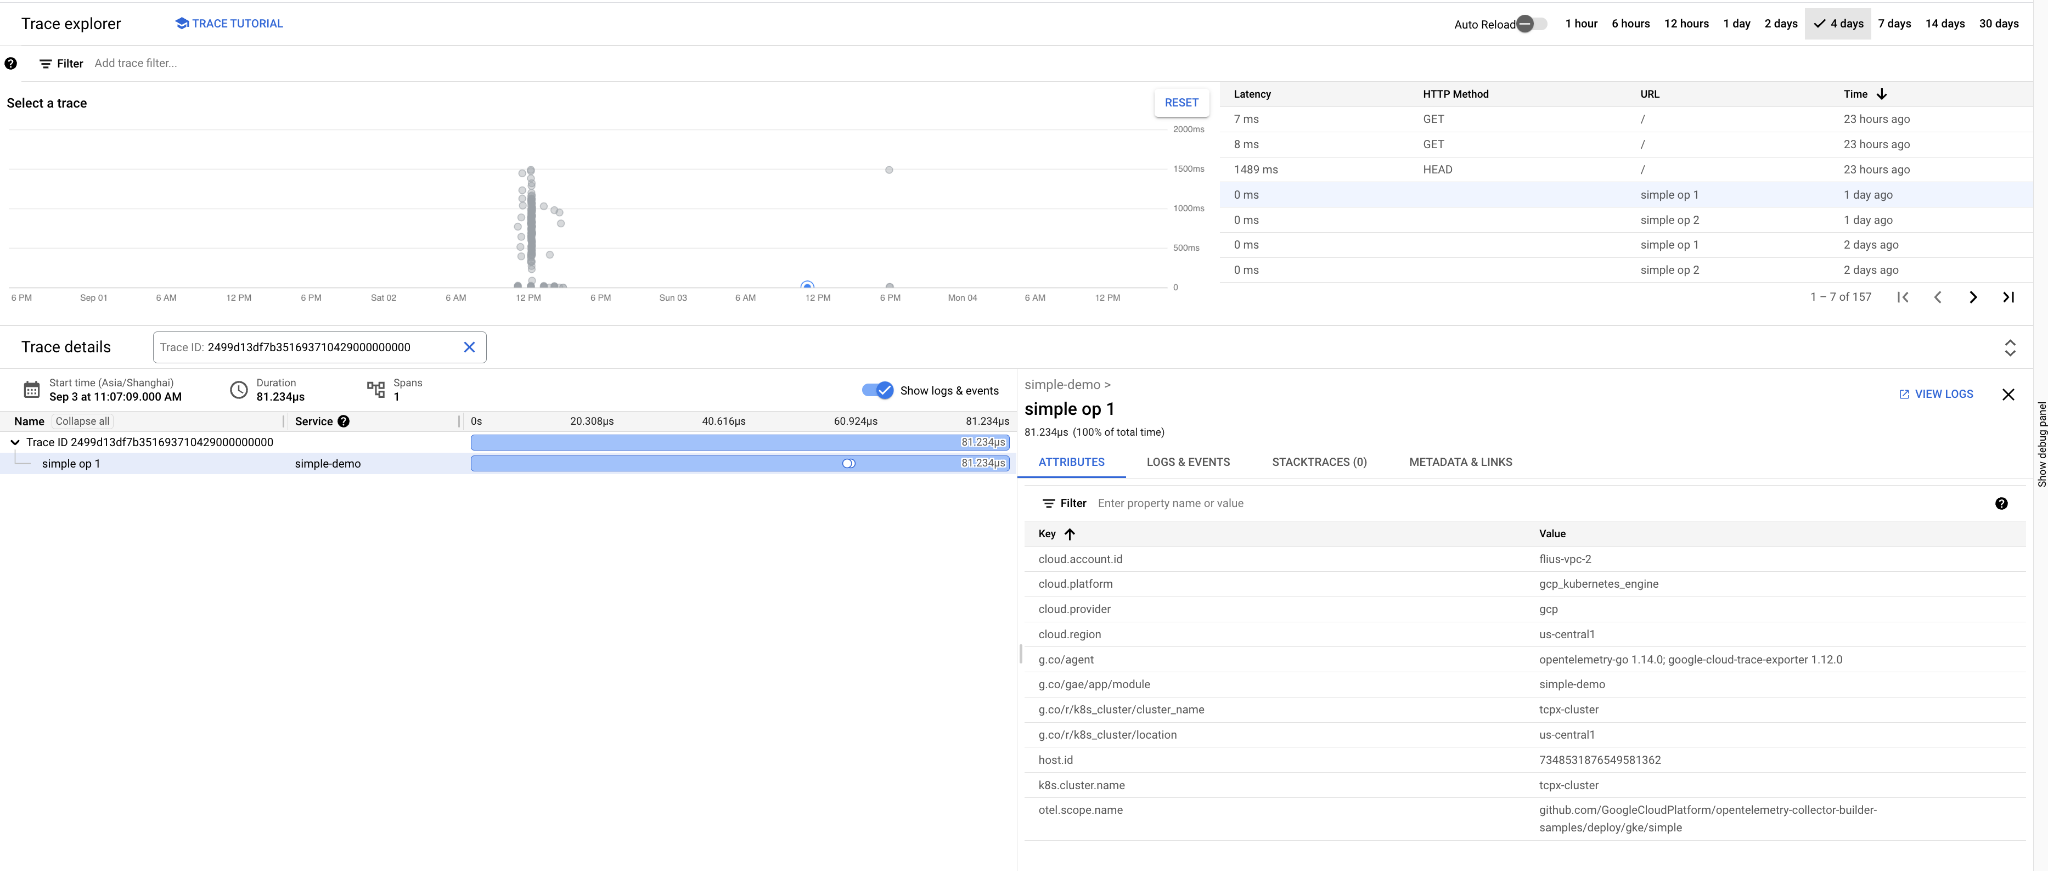
在 Trace Explorer 中查看
将 Trace 导出
创建 Trace 接收器
gcloud alpha trace sinks create ${SINK_ID} ${DESTINATION} |
SINK_ID:接收器的名称或标识符。例如 my-sink。
DESTINATION:存储目标的完全限定名称。这必须是一个 BigQuery 数据集。例如:
bigquery.googleapis.com/projects//datasets/ |
其中 DESTINATION_PROJECT_NUMBER 是目标的 Google Cloud 项目编号,DATASET_ID 是 BigQuery 数据集标识符。
查看 BigQuery DataSet 中的数据
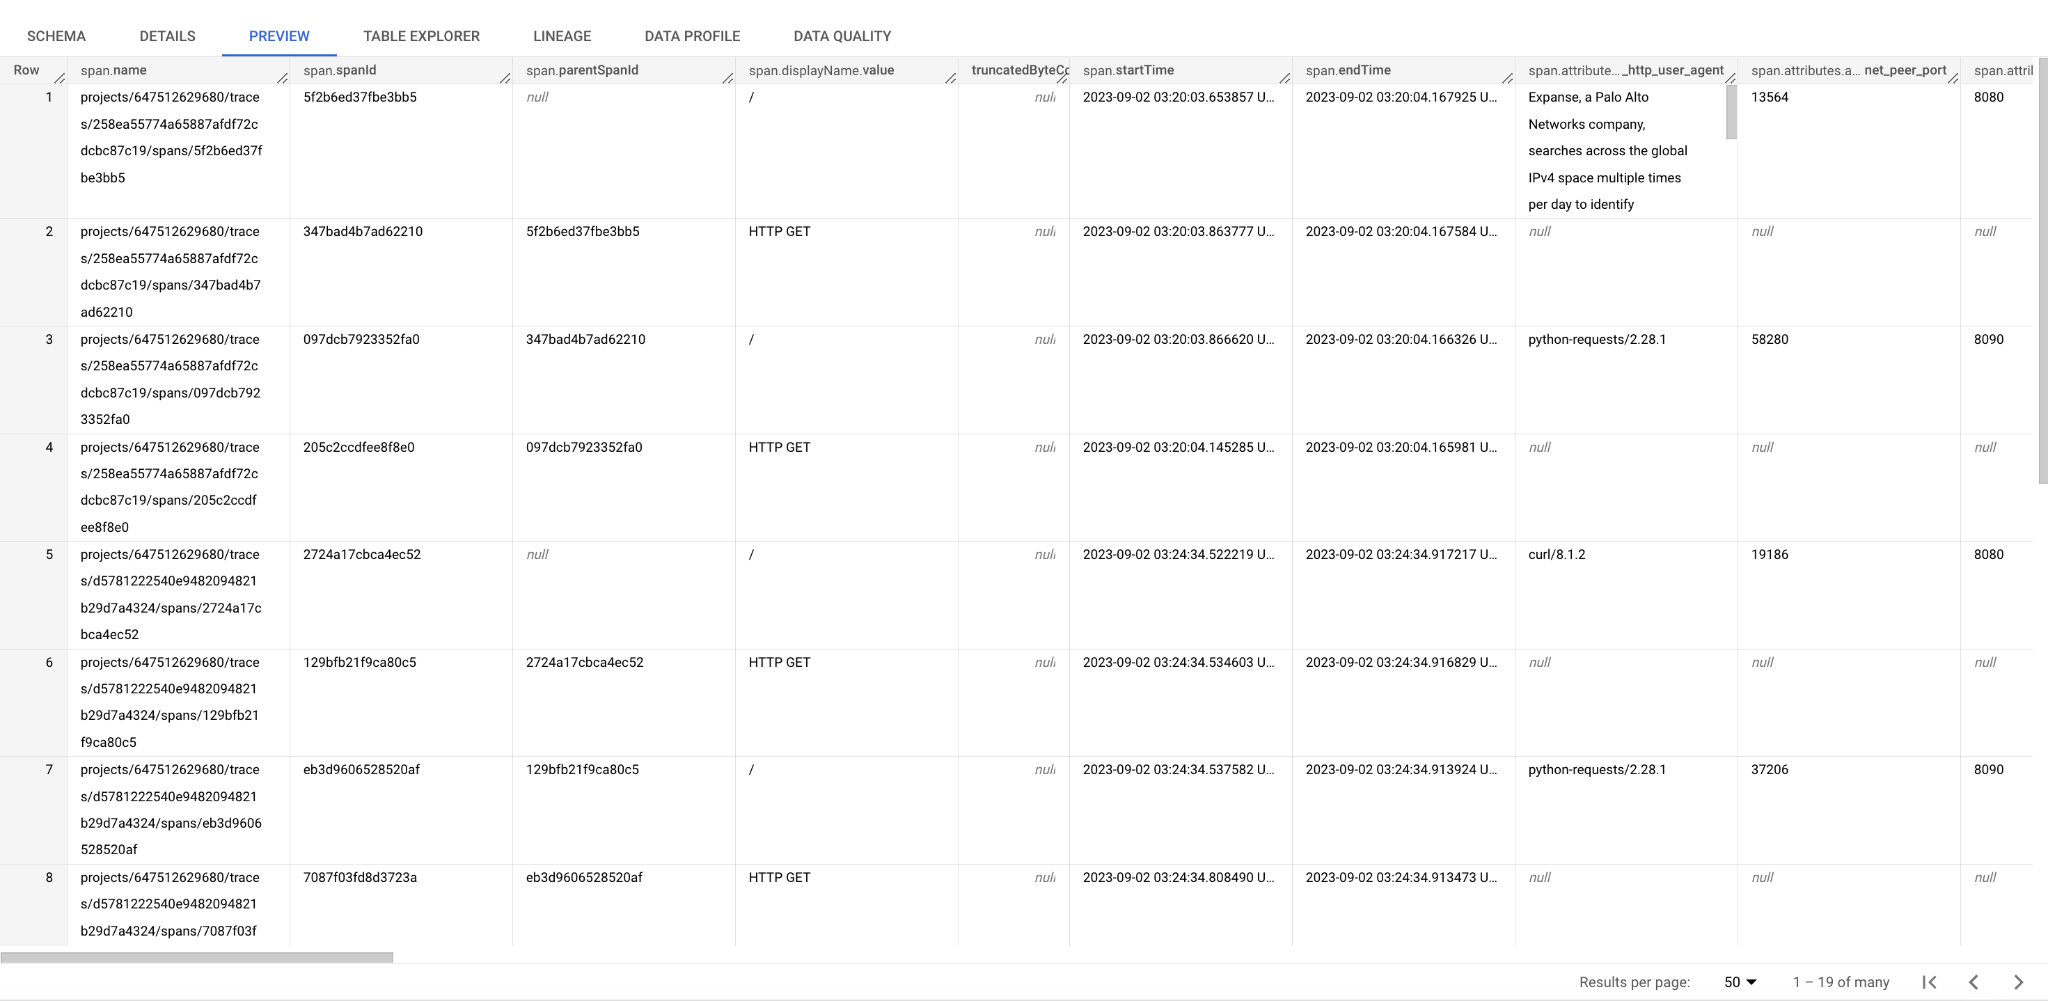
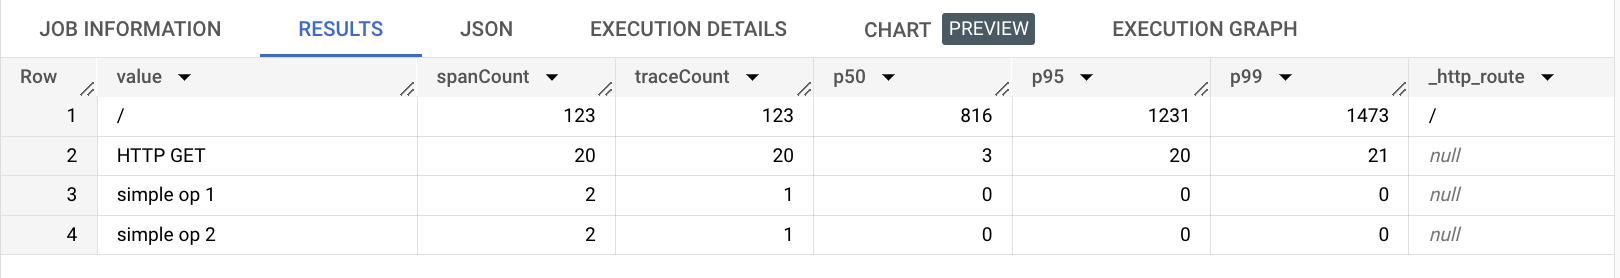
您还可以使用 SQL 来汇总,如按跟踪记录计数排序的结果。这里 span.name 中有 project number 的信息,您可以根据这个属性来进行不同项目租户的汇总。
SELECT t0.span.displayName.value, count(t0.span.spanId) as spanCount, count(distinct traceId) as traceCount, APPROX_QUANTILES(milliseconds, 100)[OFFSET(50)] as p50, APPROX_QUANTILES(milliseconds, 100)[OFFSET(95)] as p95, APPROX_QUANTILES(milliseconds, 100)[OFFSET(99)] as p99, t0.span.attributes.attributeMap._http_route FROM ( SELECT *, REGEXP_EXTRACT(span.name, r"./traces/([a-f0-9]+).") as traceId, TIMESTAMP_DIFF(span.endTime,span.startTime, MILLISECOND) as milliseconds FROM trace_dataset.cloud_trace WHERE DATE(_PARTITIONTIME) = "2023-09-02") AS t0 WHERE t0.span.parentSpanId is NULL GROUP by t0.span.displayName.value, t0.span.attributes.attributeMap._http_route ORDER BY traceCount DESC LIMIT 1000 |
方便地查询 P50, P95, P99 的延迟
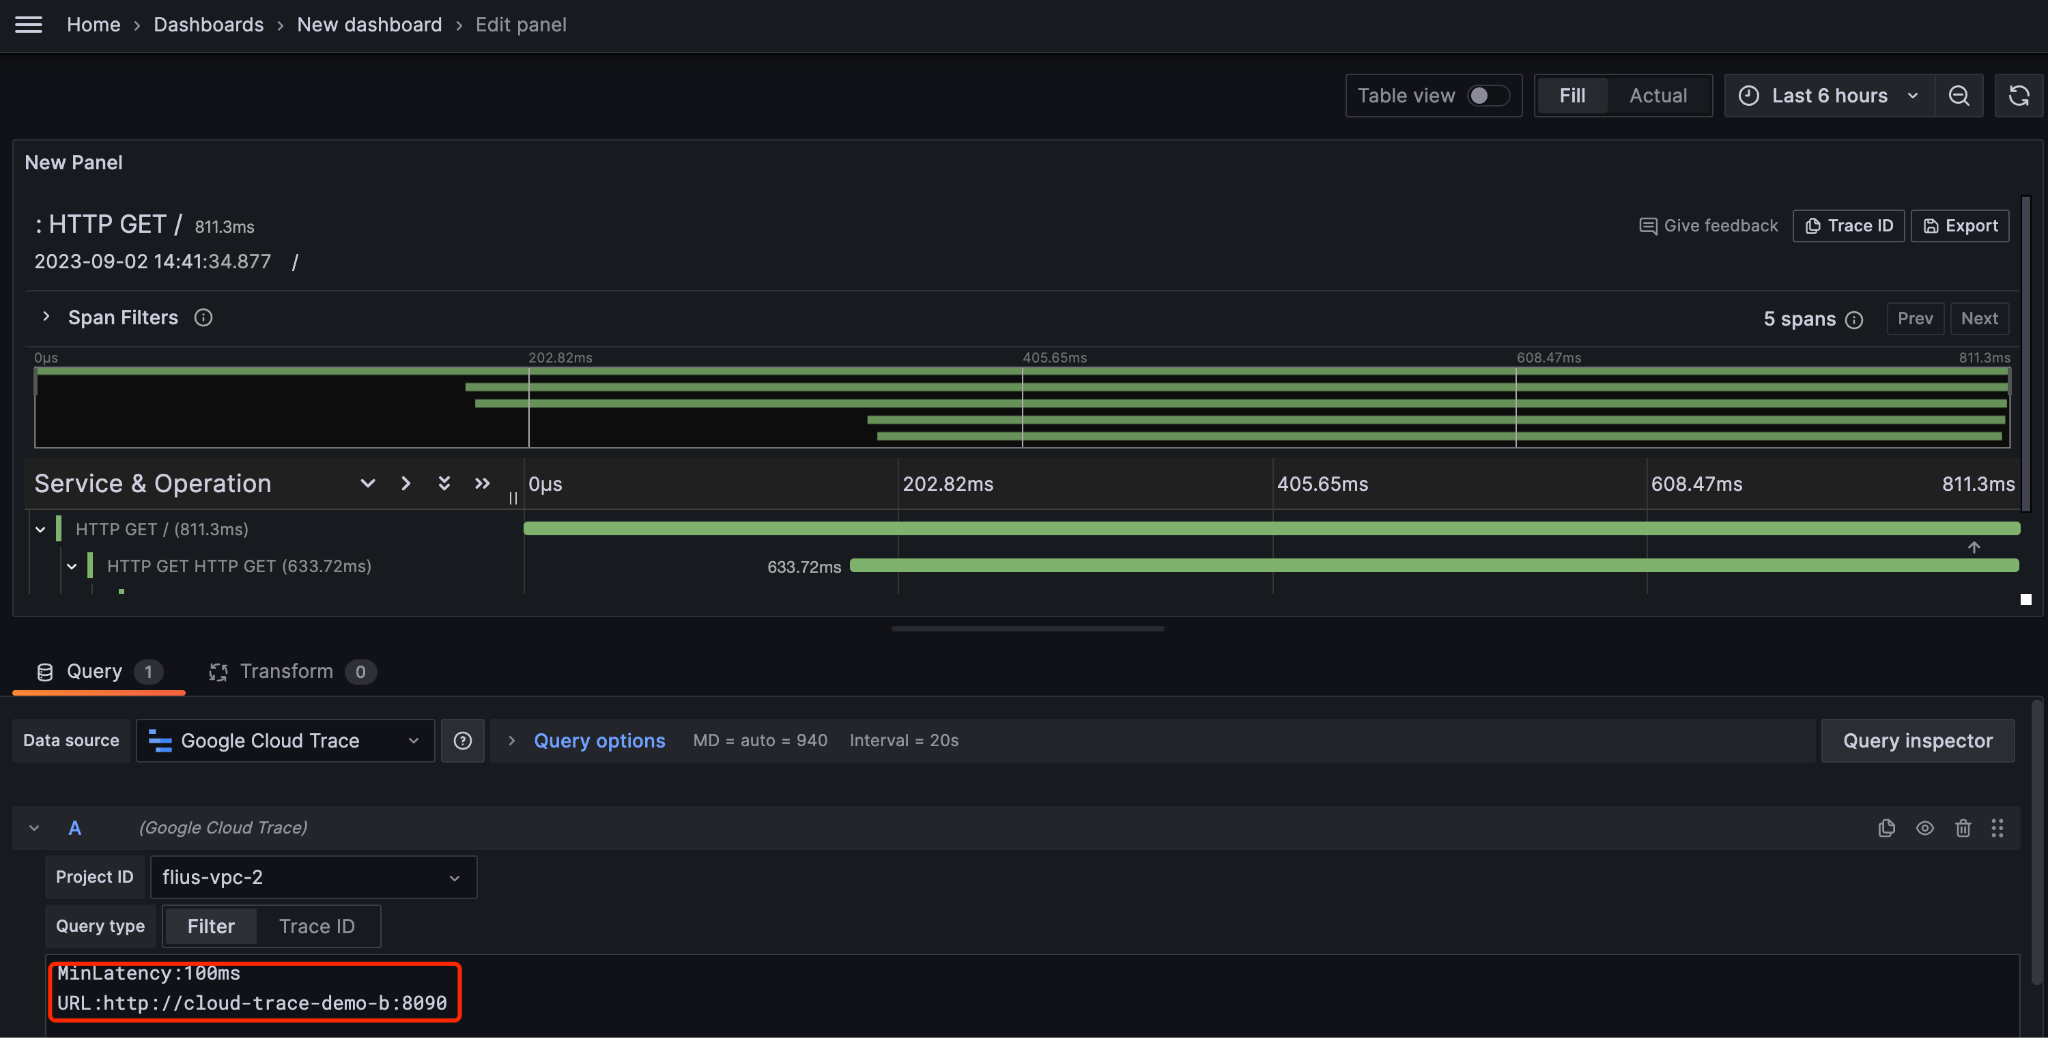
Grafana
你还可以通过安装 Grafana 的 Cloud Trace plugin 来查看追踪,具体做法参见:
https://grafana.com/grafana/plugins/googlecloud-trace-datasource/
总结
本文讨论了在 GCP 上,对多租户可观测性数据(日志、监控、追踪)统一收集、汇总和管理的解决方案推荐,方便 GCP 的用户进行进一步的数据分析和拆分租户计费报告等。
文章信息
相关推荐
精选内容

关注【谷歌云服务】
微信公众号
微信公众号
微信咨询:
周一至周五 早上 9 点到晚上 6 点
联系我们